Wandas: Waveform Analysis Data Structures
Wandas is an open-source library for efficient signal analysis in Python. Wandas provides comprehensive functionality for signal processing and seamless integration with Matplotlib.
Wandas は、Pythonによる効率的な信号解析のためのオープンソースライブラリです。Wandas は、信号処理のための包括的な機能を提供し、Matplotlibとのシームレスな統合を実現しています。
Features / 機能
-
Comprehensive Signal Processing Functions: Easily perform basic signal processing operations including filtering, Fourier transforms, and STFT. 包括的な信号処理機能: フィルタリング、フーリエ変換、STFTなど、基本的な信号処理操作を簡単に実行可能。
-
Integration with Visualization Libraries: Seamlessly integrate with Matplotlib for easy data visualization. 可視化ライブラリとの統合: Matplotlibとシームレスに統合してデータを簡単に可視化可能。
-
Lazy Evaluation: Efficiently process large data using dask. 遅延評価: daskを活用した効率的な大規模データ処理。
-
Various Analysis Tools: Frequency analysis, octave band analysis, time-frequency analysis, and more. 多様な分析ツール: 周波数分析、オクターブバンド分析、時間-周波数分析など。
-
Typed Cepstral Analysis: Extract, lifter, and reconstruct spectral envelopes while preserving lazy execution and metadata. 型付きケプストラム解析: 遅延実行とメタデータを維持しながら、ケプストラム抽出、リフタリング、スペクトル包絡再構成を実行。
Usage Examples / 使用例
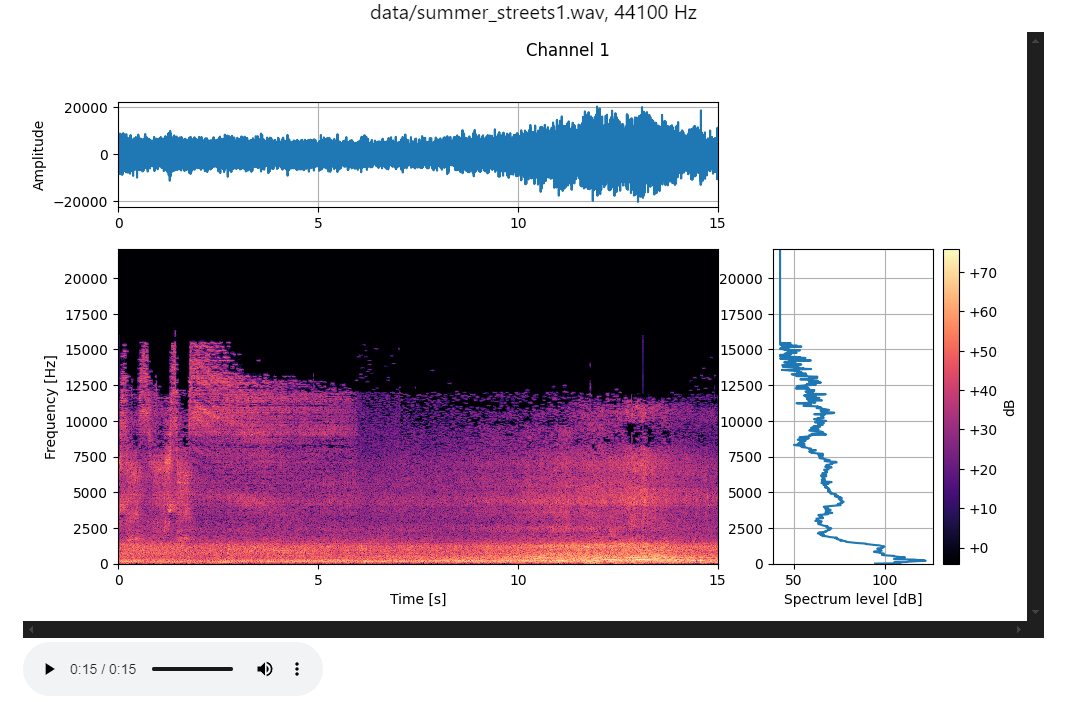
Loading and Visualizing Audio Files / 音声ファイルの読み込みと可視化
import wandas as wd

# Read the bundled sample / 同梱サンプルを読み込む
url = "https://raw.githubusercontent.com/kasahart/wandas/main/learning-path/sample_audio.wav"
audio = wd.read(url, end=15).get_channel(0)

# Generate the committed figure / コミット済み画像を生成する
audio.describe(fmin=20, fmax=8_000, vmin=-80, vmax=-20, image_save="read_wav_describe.png")
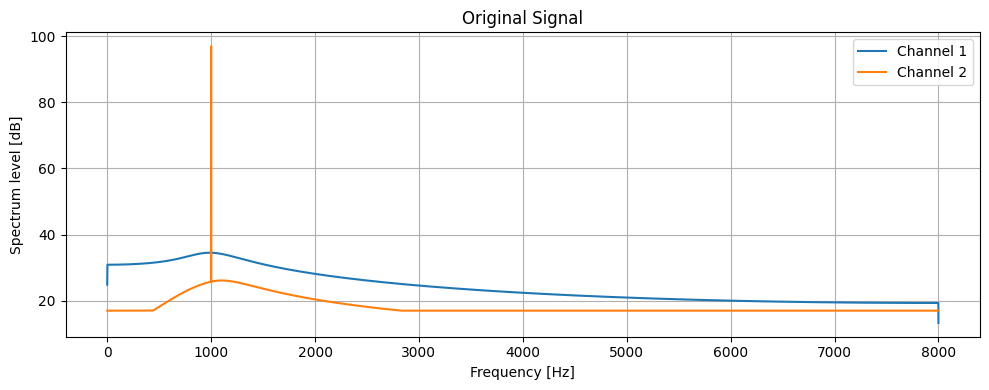
Filtering / フィルタ処理
import wandas as wd

# Generate a test signal
# テスト信号を生成
signal = wd.generate_sin(freqs=[5000, 1000], duration=1)

# Apply low pass filter and plot FFT
# ローパスフィルタを適用し、FFTをプロット
signal.low_pass_filter(cutoff=1000).fft().plot()
For detailed documentation and usage examples, see the Tutorial.
詳細なドキュメントや使用例については、チュートリアルをご覧ください。
Documentation Structure / ドキュメント構成
- Tutorial / チュートリアル
- 5-minute getting started guide and recipe collection for common tasks.
-
5分で始められる入門ガイドと一般的なタスクのレシピ集。
- Detailed API specifications.
-
詳細なAPI仕様。
- Design philosophy and algorithm explanations.
-
設計思想とアルゴリズムの解説。
- Rules and methods for contribution.
- コントリビューションのルールと方法。
License / ライセンス
This project is released under the MIT License.
このプロジェクトは MITライセンス の下で公開されています。